Strategy
The ROI of B2B Branding: How to Measure What Brand Is Worth
Brand ROI in B2B shows up as less friction in the sales cycle, not as next quarter's leads. What to measure, when to measure it, and how to make the case to a CFO.
Key takeaways
- Branding ROI in B2B is the value of less friction in the sales cycle: more buyers who know you, higher win rates, shorter cycles and less discounting.
- Record a twelve-month baseline before the brand work starts; without it, no result can be proven.
- Read leading indicators such as branded search, share of search and self-reported source in the first months after launch.
- Judge commercial outcomes such as win rate, sales-cycle length and discounting after six months and over a full year.
- Present brand to a CFO as better conversion on the existing pipeline, using the company's own numbers instead of promised multipliers.
Branding ROI in B2B is the commercial value a stronger brand creates by making deals easier to win: more buyers who already know your name, higher win rates, shorter sales cycles and less discounting. You measure it by recording a baseline before the brand work, then tracking leading indicators such as branded search in the first months and lagging indicators such as win rate and deal size over the following year.
The question usually comes up at a specific moment. A technical B2B company has grown on product strength and founder-led sales, and the old growth engine starts to slow. Acquisition costs rise, outbound converts less, and the leadership team notices that its website and sales deck sound like the three closest competitors. Marketing proposes a brand project. Finance asks what it will return.
That conversation often goes badly because both sides use the wrong model. Marketing promises leads, finance asks for attribution, and nobody agrees on what success looks like. At Sutro, where we do brand strategy for technical B2B companies, we agree on the measures before the work starts: enterprise conversion, qualified pipeline, win rate, sales-cycle length, pricing confidence, branded search, investor comprehension and recruiting strength. I have run Ramotion since 2009, across more than 350 projects, and the teams that measure brand well all do the same thing first. They decide what "worth it" means while there is still a clean before.
Why branding ROI is hard to measure in B2B
Branding ROI is hard to measure in B2B because the effect is spread across months, people and channels that attribution software can't see. A brand makes every other channel work better, so its value shows up inside other numbers rather than as a line of its own.
Three things make B2B harder than consumer marketing.
- Long sales cycles. An enterprise deal can take most of a year from first contact to signature. A brand change made in January may only show up in deals that close the following autumn.
- Buying committees. Several people from different functions weigh in on a technical purchase. Each forms an impression from different sources: a peer, an analyst, the website, a sales call. No tool records all of them.
- Indirect effects. A clearer brand rarely creates a new lead directly. It makes the paid campaign convert better, the sales deck land faster and the procurement review shorter. Last-click attribution then credits the final touch, usually a branded search or a demo form, for work the brand did months earlier.
The practical answer is to measure the brand where its effects surface, on the timeline they take.
Brand building and demand capture work on different clocks
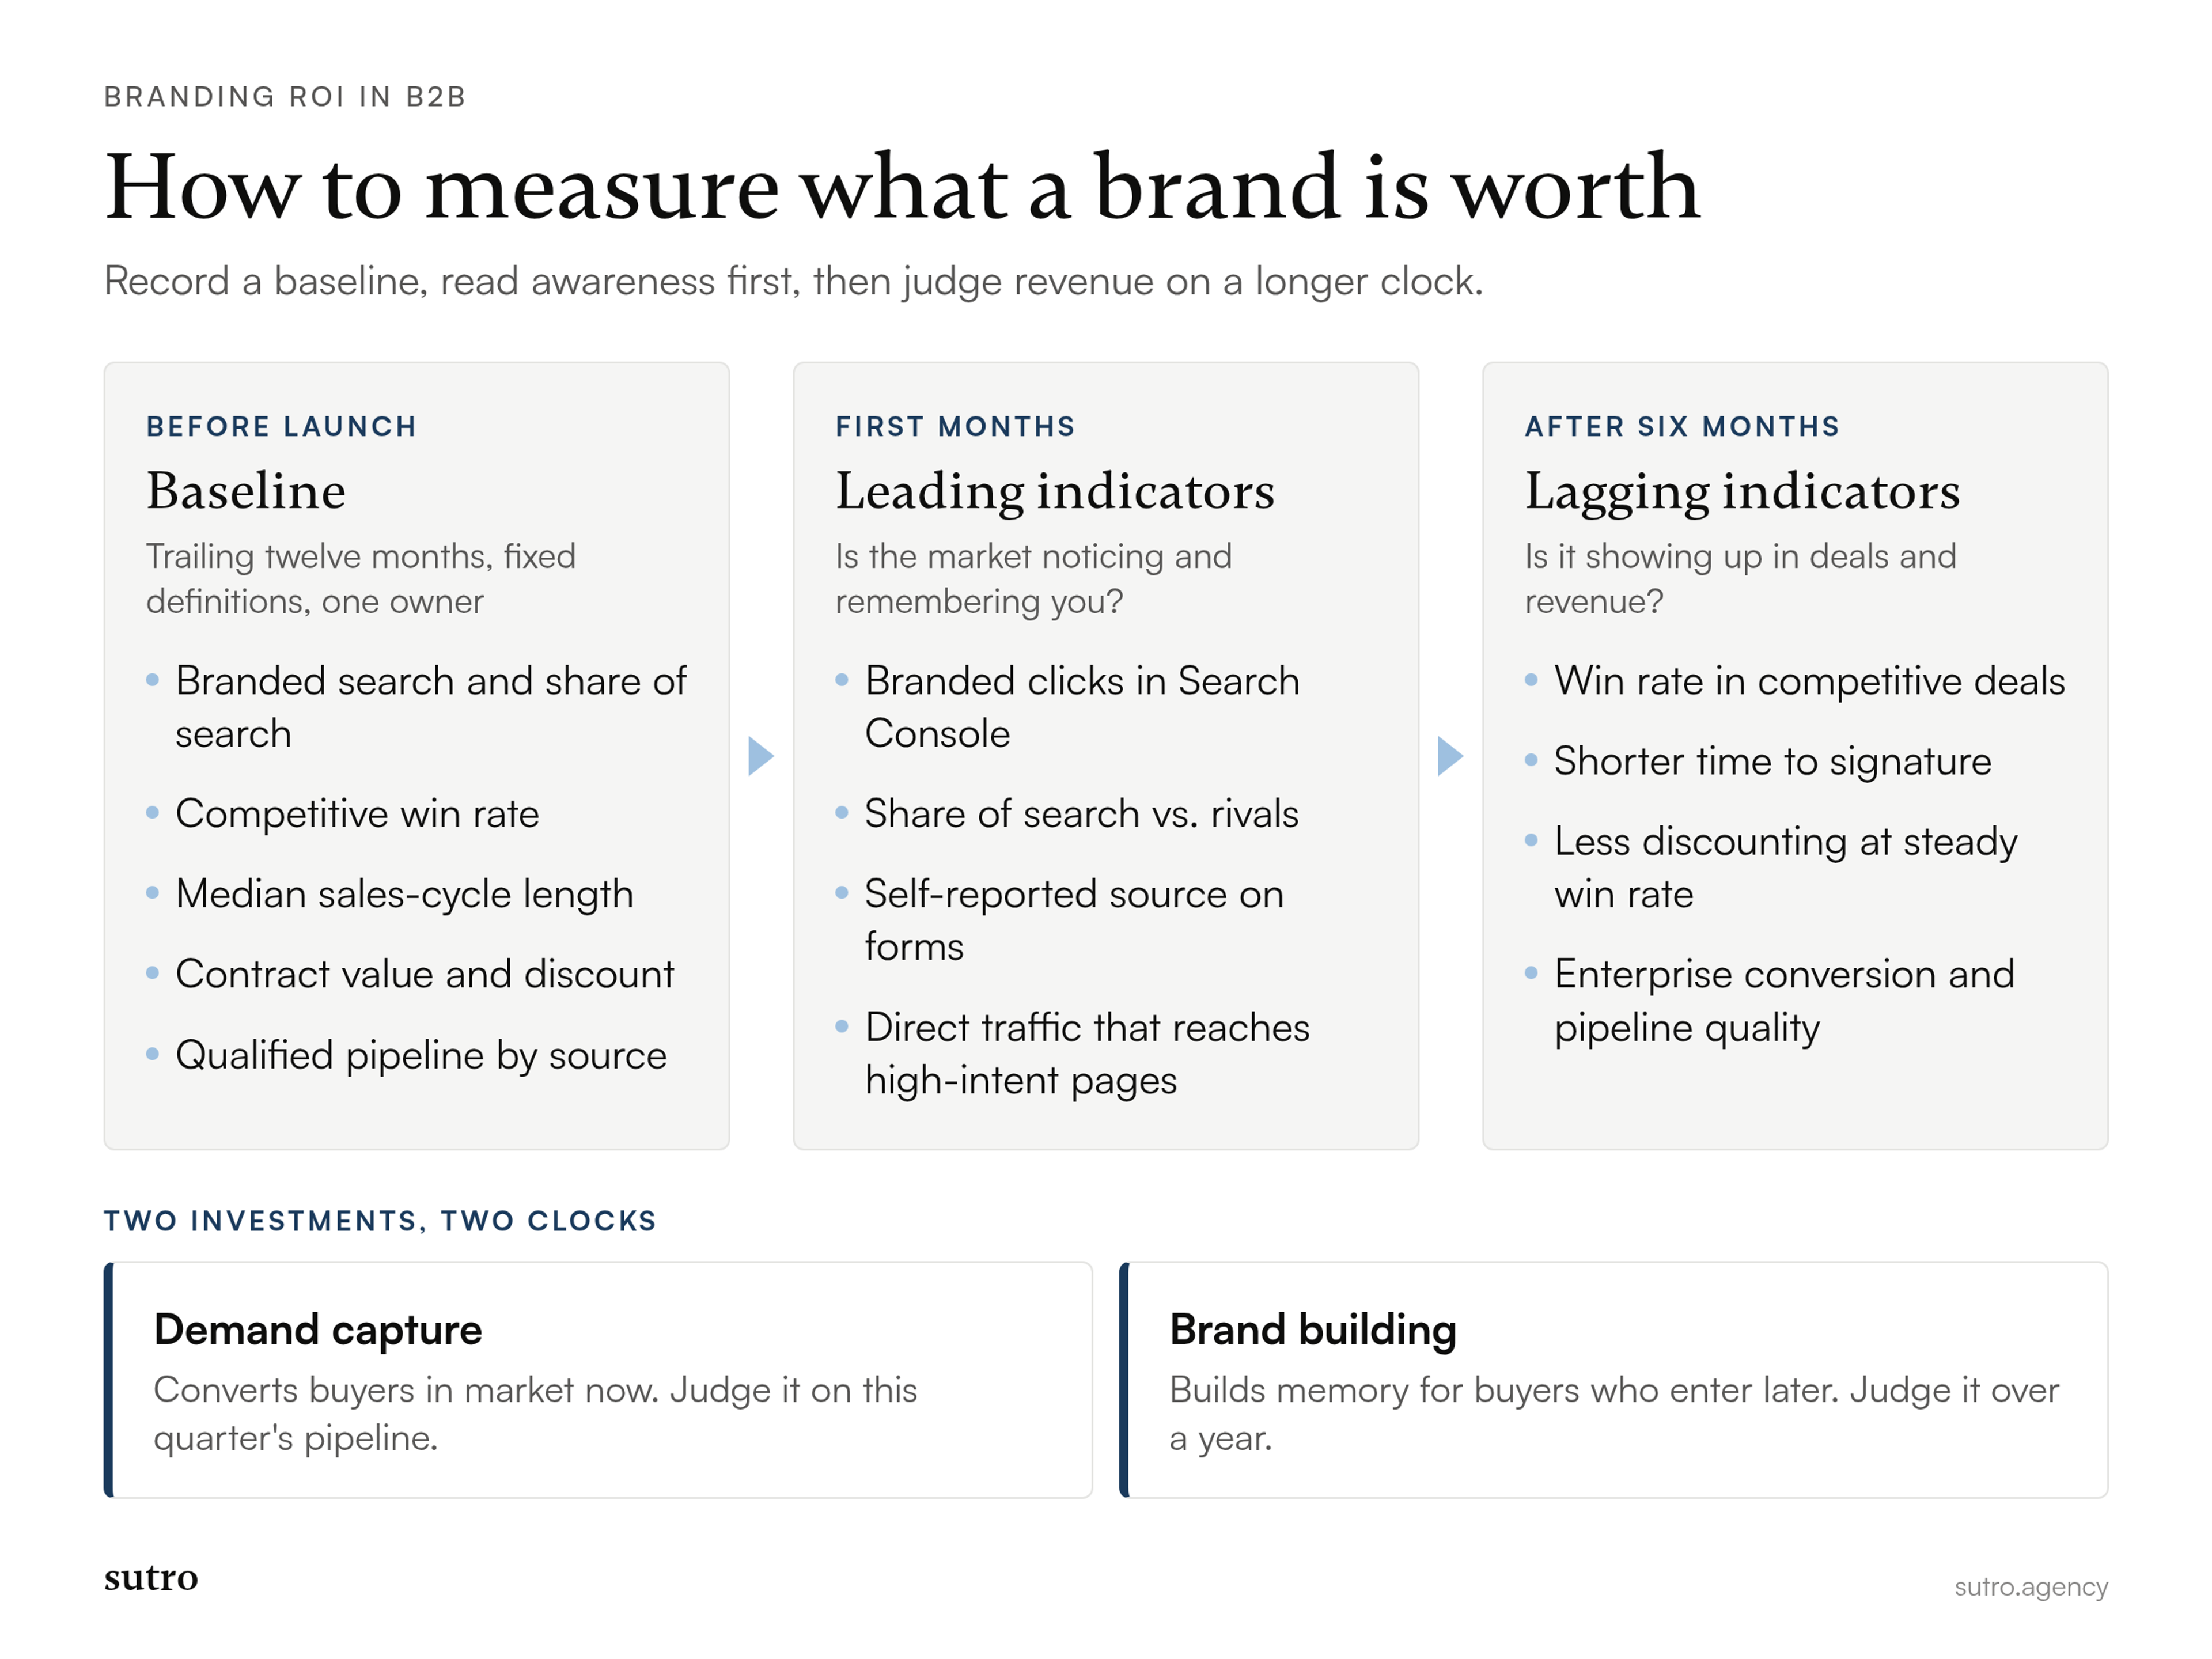
Brand building and demand capture are two different investments with different payback periods, and they need different measures. Demand capture converts buyers who are in the market now. Brand building makes sure you are the company they think of when they enter the market later.
The clearest evidence for this split comes from Les Binet and Peter Field, who analyzed the IPA effectiveness databank for B2B campaigns in a report commissioned by LinkedIn's B2B Institute (The 5 Principles of Growth in B2B Marketing). They describe sales activation as tightly targeted, good for short-term selling, with high ROI but short-lived effects. Brand building works through long-term memories and associations, its effects accumulate, and it also reduces price sensitivity. The report recommends a roughly even split of budget between the two in B2B, and it notes that long-term effects only start to dominate short-term effects after about six months.
The same report contains the number that explains most failed brand business cases: according to LinkedIn's survey, only 4% of B2B marketers measure impact beyond six months. If the review happens at month three, brand work will look weak, because its main effect has not arrived yet.
So the first rule of brand ROI is to give each investment its own clock. Judge demand programs on pipeline this quarter. Judge brand on leading indicators in the first months and on commercial outcomes after six months and beyond.
Set the baseline before the brand work starts
Without a baseline there is no ROI, only opinion. Record where the business stands before anything changes, using the same definitions you will use later.
The baseline belongs in the diagnosis phase of a brand project. In our process that phase is called Diagnose, and it comes before we define the narrative, build the brand system or activate it. If you are starting from scratch, a full brand audit before the redesign gives you both the qualitative picture and the numbers. For ROI purposes, capture at least these for the trailing twelve months:
- Branded search clicks and impressions.
- Share of search against your main competitors.
- Win rate in competitive opportunities.
- Median sales-cycle length, split by segment.
- Average contract value and average discount.
- Qualified pipeline by source, including self-reported source.
- Conversion from first meeting to qualified opportunity in enterprise deals.
Write down how each number is defined and where it comes from. Name one owner, usually in marketing operations or revenue operations, who will pull the same reports at each checkpoint.
Leading indicators: is the market remembering you?
Leading indicators show whether buyers notice, remember and look for the company before the effect reaches closed deals. They move first, so they are the evidence you report in the first months after a launch.
Branded search in Google Search Console
Branded search is the most direct sign that more people know your name and seek you out. When buyers remember a company, they type its name instead of a generic category query.
Google Search Console now separates this for you. Its Performance report has a branded and non-branded query filter, which Google describes as a way to measure brand awareness; branded queries include your brand name, domain or brand-specific products, including misspellings (Search Console Help: Performance report use cases). Compare branded clicks and impressions for the same months year over year, so seasonality doesn't distort the reading.
Share of search
Share of search puts your branded demand in the context of the category. It is your branded search volume divided by the total branded search volume of all brands in your competitive set.
Les Binet presented the metric at the IPA's EffWorks Global 2020 conference. In the categories he studied, share of search correlated with market share and acted as a leading indicator of it, with lead times of up to a year for cars, and the data can be taken from Google Trends (IPA: Binet presents Share of Search metric). Binet's categories were consumer markets, so treat it as a directional signal in B2B, where search volumes are smaller. Pick the competitor set once and keep it fixed.
Self-reported attribution
Self-reported attribution captures the word of mouth, podcasts, communities and private conversations that analytics can't track. You get it by asking.
Add an open-text field to the demo or contact form: "How did you hear about us?" Then have sales ask the same question on the first call and record the answer in the CRM. Categorize the answers monthly. Over time you will see how much pipeline starts with someone who already knew the name, which is exactly the effect brand work is meant to create.
Direct traffic and engagement
Direct and branded traffic quality tells you whether the people who arrive understand what you do. A clear positioning shows up as visitors who move from the homepage to product, security and pricing pages instead of leaving.
Track direct and branded-search sessions, engagement rate and the share of visits that reach a high-intent page. These numbers are noisy; read them next to branded search and self-reported source.
Lagging indicators: is it showing up in revenue?
Lagging indicators are the financial return: deals won, time saved and price held. They take longer to move than awareness, but they are the numbers a CFO cares about, so the measurement plan has to reach them.
Win rate in competitive deals
Win rate is the clearest commercial test of positioning. If buyers understand why you are different before the first call, you win more of the deals where they compare you with named competitors.
Measure win rate only in competitive opportunities, and pair it with win/loss interviews. The numbers tell you that something moved. The interviews tell you whether the brand was the reason, for example when lost buyers stop describing you as "the smaller option."
Sales-cycle length
A trusted brand shortens the time between first meeting and signature. Procurement asks fewer questions about stability, champions find it easier to explain the product internally, and fewer deals stall in "no decision."
Track median days to close by segment and deal size. Medians resist distortion from a few unusually long enterprise deals better than averages do.
Pricing power and discounting
Pricing power is the most underrated return on brand. Binet and Field note that brand building reduces price sensitivity, and the same LinkedIn survey found that only 30% of B2B marketers believe advertising affects pricing power.
Kantar's BrandZ valuation makes the same point from the finance side: it measures the part of a company's value driven by brand through Demand Power, Pricing Power (the ability to command a premium) and Future Power (Kantar BrandZ Most Valuable Global Brands). For your own business, track average contract value and average discount by segment. A sales team that discounts less while win rate holds steady is showing you brand equity in cash.
Pipeline quality and enterprise conversion
Pipeline quality shows whether the brand attracts the buyers the business wants. Count qualified opportunities rather than leads, and watch conversion from first meeting to opportunity in the enterprise segment, since moving upmarket is often the reason for the brand work in the first place.
Two softer outcomes belong in the same review: candidates who mention the brand in recruiting, and how clearly investors can repeat the company story. Both matter at a raise or an exit.
Methods that hold up under scrutiny
The strongest brand ROI case combines several imperfect methods rather than trusting one. Each method covers a weakness in the others.
- Before and after. Compare the baseline with the same metrics at each checkpoint. Simple, but other changes in the business can explain part of the difference.
- Holdout or staged rollout. If you launch a campaign in some regions or segments first, the others become a comparison group. This is the closest most B2B companies get to a controlled test.
- Buyer surveys and brand lift. Ask target accounts about aided and unaided awareness before and after. Keep the questions and the sample identical.
- Win/loss interviews. Ask recent buyers and lost prospects how they first heard of you and how they described you to colleagues. Use the same script each round.
- Marketing mix modeling. With enough spend and history, a statistical model can separate brand and activation effects. It needs years of consistent data, which many growth-stage B2B companies don't have yet.
When to read each number
A brand measurement plan needs dates as well as metrics. Without them, someone checks too early and calls the project a failure.
- Before launch: record the trailing twelve-month baseline and name the owner.
- First months after launch: read the leading indicators, branded search, share of search, self-reported source and traffic quality.
- After six months: start reading win rate, sales-cycle length, discounting and pipeline quality against the baseline.
- After a full year: compare twelve months against twelve months, adjusted for any change in sales headcount, pricing or product.
Put the checkpoints in the calendar on the day the project starts, and agree with finance in advance which numbers will be reviewed at each one.
How to present branding ROI to a CFO
Present brand ROI to a CFO as a change in conversion efficiency on the pipeline you already have, not as a promise of new leads. Finance trusts arithmetic built on its own numbers far more than multipliers from a marketing report.
Start with the baseline. Then show what a modest improvement in each lagging metric would be worth, using the company's real pipeline, win rate, cycle length and average discount. The CFO can adjust the assumptions, and that is the point: the model becomes shared, not sold.
Frame the brand as commercial infrastructure. If the company is spending more every quarter on demand programs while buyers can't tell it apart from competitors, part of that spend is being wasted at the bottom of the funnel. A clearer brand raises the return on everything poured into it. Avoid precise revenue multipliers for the brand itself. Nobody can promise them honestly, and one inflated number can end the conversation.
Agree on what failure looks like, too. If branded search, win rate and discounting have not moved after a year, the brand did not work, and the company should know that.
Common mistakes in measuring brand ROI
Most brand measurement fails for operational reasons, not analytical ones. These are the mistakes I see most often.
- Judging brand on last-click attribution. Brand builds the memory; a search ad or form captures the click later. Report the two separately.
- Measuring too early. A review at month three captures the leading indicators at best. The commercial effect needs more time.
- No baseline. Without a clean before, any improvement can be explained away and any decline blamed on the brand.
- Vanity metrics. Impressions, likes and video views measure distribution, not preference. If they never turn into branded search, better win rates or less discounting, the message is reaching the wrong people or saying the wrong thing.
- Changing definitions midway. A new CRM stage, a new competitor set or a new attribution rule breaks the comparison. Freeze definitions for the measurement year.
Conclusion
Branding ROI is real and measurable, but it shows up as less friction across the commercial process rather than as a campaign report. Record the baseline, give brand its own clock, read leading indicators first and lagging indicators after six months, and build the CFO case on the company's own numbers.
The companies that do this end up with something more useful than a single ROI figure: a shared view of how the brand affects pipeline, win rate and price. If you are heading into a commercial inflection and want to plan that measurement before the brand work starts, tell us what you are measuring today.
Questions
- What is branding ROI in B2B?
- Branding ROI is the commercial return a stronger brand produces, measured through its effect on how easily the company wins business. In B2B that shows up as more branded search, more qualified inbound pipeline, higher competitive win rates, shorter sales cycles and less discounting, rather than as a direct revenue line.
- How long does it take to see ROI from a B2B brand project?
- Leading indicators such as branded search and self-reported source can move in the first months after launch. Binet and Field's analysis for LinkedIn's B2B Institute found that long-term brand effects start to dominate short-term ones after about six months, so plan to judge commercial outcomes after six months and compare full years.
- What is share of search?
- Share of search is your branded search volume divided by the branded search volume of all brands in your competitive set. Les Binet's IPA work found it tends to lead market share in the categories he studied. In B2B, keep the competitor set fixed and read it as a direction, since search volumes are smaller.
- Can you use attribution software to measure brand ROI?
- Only partly. Multi-touch and last-click models see digital touches, and they usually credit the final branded search or form fill for preference the brand built earlier. Combine analytics with self-reported attribution, win/loss interviews and before-and-after comparisons against a baseline.
- Should a brand project promise a specific revenue multiple?
- No. Nobody can honestly promise a revenue multiple for a brand. A stronger case shows what modest, agreed improvements in win rate, cycle length or discounting would be worth on the company's actual pipeline, and lets finance adjust the assumptions.
Sources
- LinkedIn B2B Institute, Binet & Field: The 5 Principles of Growth in B2B Marketing (PDF)
- Google Search Console Help: Performance report, common tasks and use cases (branded queries filter)
- IPA: Binet presents fast, cheap, predictive Share of Search metric (EffWorks Global 2020)
- Kantar BrandZ Most Valuable Global Brands: how brand value is measured